“During times of universal deceit, telling the truth becomes a revolutionary act” _George Orwell
About Me
- Name: al fin
- Location: North America
Primary interest is seeing that the best of humanity survives long enough to reach the next level.
Previous Posts
- Stupidity Kills----Part I: Malaria
- As Fat as You Want to Be
- A Life on the Sea--Seasteading: The Book
- Starting Over, Returning to the Roots, Waking Up
- Cryogenics, Human Growth Hormone, and the Will to ...
- Big Business Discovers Butanol--Renewable Energy G...
- Leapfrog University--Rejecting Indoctrination in F...
- God and Orgasms: Seeking Pleasure, Transcendance,...
- Silicon Free Solar Cells? Bypassing Peak Energy
- A "Smart" Petri Dish? Using Nanotechnology for Ma...


2 Comments:
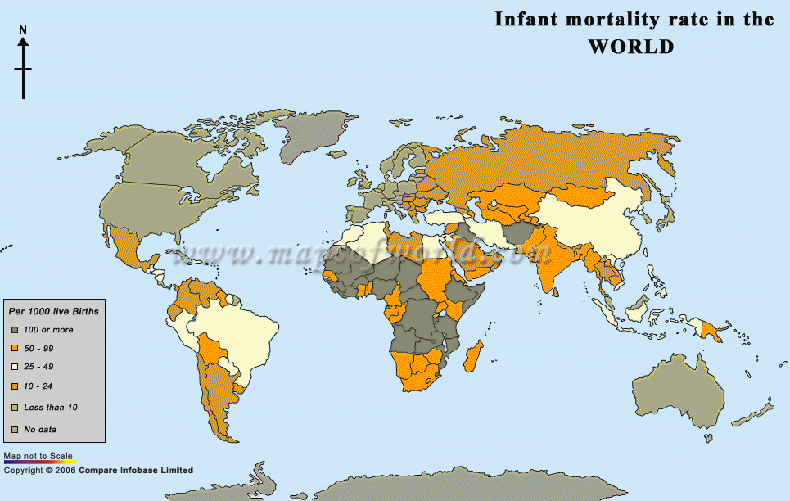
Cool maps.
I am wondering, what is the source for the corruption map?
I had always thought that oil/mineral wealth and corruption went together, but I had never seen it on a map like this. But I am curious how they define a "mineral or oil dependent economy". Is it if they are over a certain percentage of GDP? I would have thought that Canada would be listed as a mineral/oil economy if Norway and Australia were considered as such.
Google image search can find some good maps if you keep looking. Other large image searches probably work as well--Yahoo, MSN, etc.
Click on the corruption map and you will get an enlarged version of the map. It tells you roughly how they determined mineral dependency or oil dependency. They calculated them separately, so neither minerals alone nor oil alone constitute a high enough fraction of Canada's GDP to make the list.
Had they calculated mineral dependency combined with oil dependency, Canada would probably make the list.
Post a Comment
“During times of universal deceit, telling the truth becomes a revolutionary act” _George Orwell
<< Home